 Every real estate investment market is unique and has it’s own thumb print. Denver is no exception and often surprises prospective buyers or real esate investors when they see the Denver real estate chart.
It surprises them, because the media leads most people to think that the entire country was experiencing a massive housing bubble from the early 2000’s through 2007. This was true on a US macro level and in specific markets like Las Vegas, Phoenix and Cape Coral.
What most people do not know is that only 25 of the roughly 400 major real estate markets (7% of the US) experienced a true housing boom, defined by a four-year total home appreciation greater than 80 percent.
Only 75 of the 400 major markets (20 percent of the US) realized total appreciation between 38% and 78%. 50% of U.S. housing markets realized cumulative home price appreciation lower than 9% for that entire four-year period.
Approximately 25 percent of the 400 major U.S. real estate markets never realized even 6% total appreciation during those four so-called “boom” years. Not what you would expect from watching TV.
Denver is very unique, because it was acutally experiencing depreciation during the “bubble years”mainly due to the dot com bust.
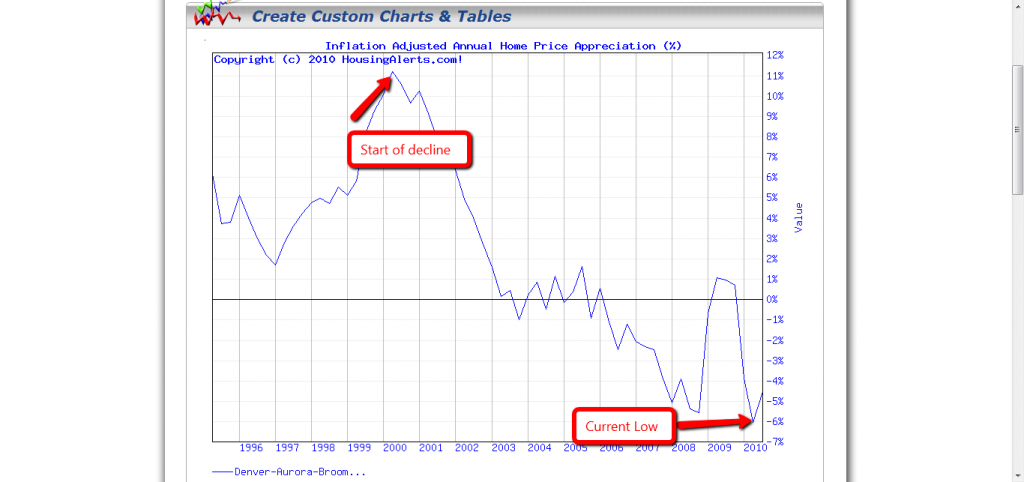
Here is an inflation adjusted appreciation chart for the Denver – Aurora – Broomfield market:
As you can see from the chart, in early 2000, the Denver market began to decline and did not reach any significant rebound until late 2008 when the stock market began to plummet.
The increase was due to the tax credit, which boosted the market about 6% from late 2008 to mid 2010. It fell again once it expired and demand tapered off. The market had a slow few months, as prospective buyers rushed to the finish line to purchase for the $8,000 tax credit.
Since August, the market activity has nearly doubled and is operating on free market supply and demand fundamentals driven by historically low interest rates, opposed to false demand with government incentives (social engineering).
I personally am a real estate investors in foreclosure during this current market cycle and do not see a significant change in the market, although I do not see a significant drop in the future unless something major changes, such as a spike in interest rates, or a new government program is introduced.
Currently homes can be purchased distressed well below replacement cost and most homes on the end user market can be purchase just under or at replacement cost. Buidling is slow and will continue to main slow until the supply and demand are back in equilibrium.
The Denver real estate chart is interesting and one that has been fairly true to it’s historical pattern. This real estate chart and techniques used to help predict the market cycle are modeled after Ken Wade, a Harvard MBA and CPA who through 30 years of real estate investing has implimented the same Wall St techniques to real estate.
To Learn more about the techniques to better predict market cycles in any market click here.
Related posts:

Leave a Reply
You must be logged in to post a comment.